Let us command the computer to generate some more art!
Below is a modification from previous post.
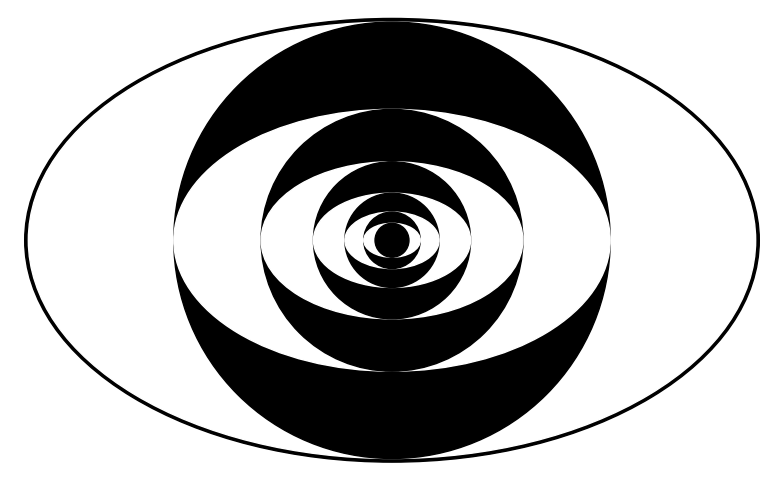
|
plt=Graphics()
n = 5
plt += ellipse((0,0),5.05,3.05,fill=1,color='black')
for i in range(n+1):
    plt += ellipse((0,0),(3/5)^i*5,(3/5)^i*3,fill=1,color='white')
    plt += circle((0,0),(3/5)^i*3,color='black',fill=1)
plt.show(frame=0,axes=0)
|
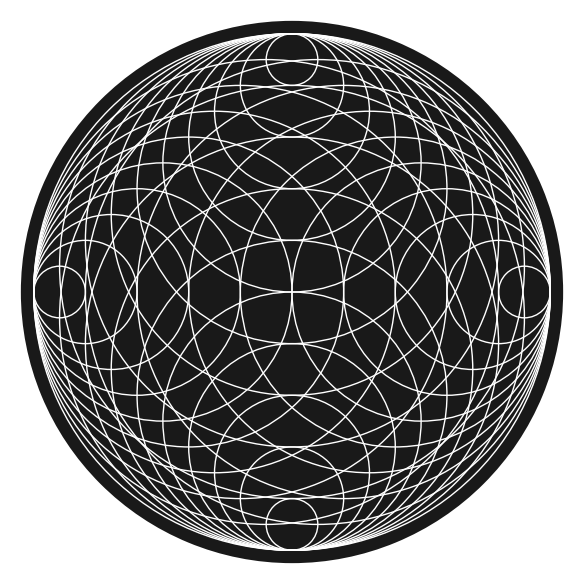
|
plt=Graphics()
n = 10
for i in range(1,n+1):
    plt += circle((0,1-i/n),1-i/n,color='white')
    plt += circle((i/n,1),1-i/n,color='white')
    plt += circle((-i/n,1),1-i/n,color='white')
    plt += circle((0,2-i/n),i/n,color='white')
plt += disk((0,1),1.05,(0,2*pi),color='black',alpha=0.9)
plt.show(frame=0,axes=0)
|
|
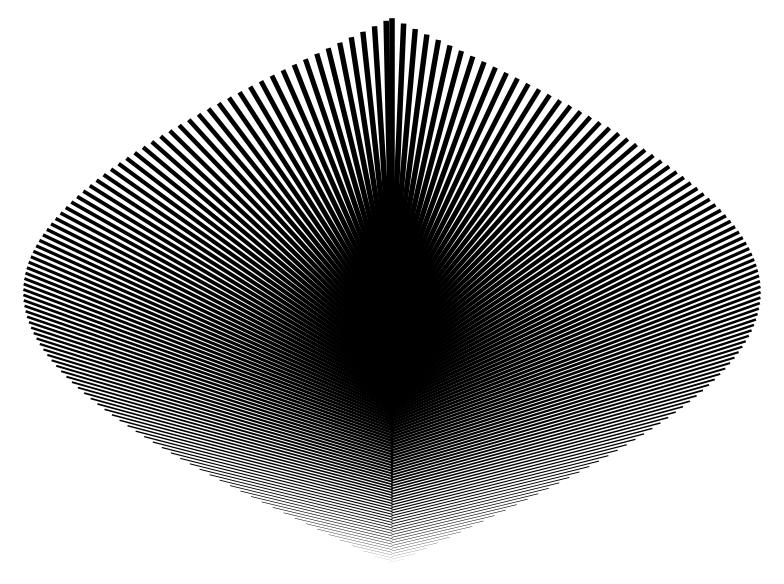
plt=Graphics()
n = 200
for i in range(1,n+1):
    plt += line2d([(0,i/n),((-1)^i*sin(pi/n*i),2*i/n)],color='black',thickness=(i/n)*n/50)
plt.show(frame=0,axes=0)
|
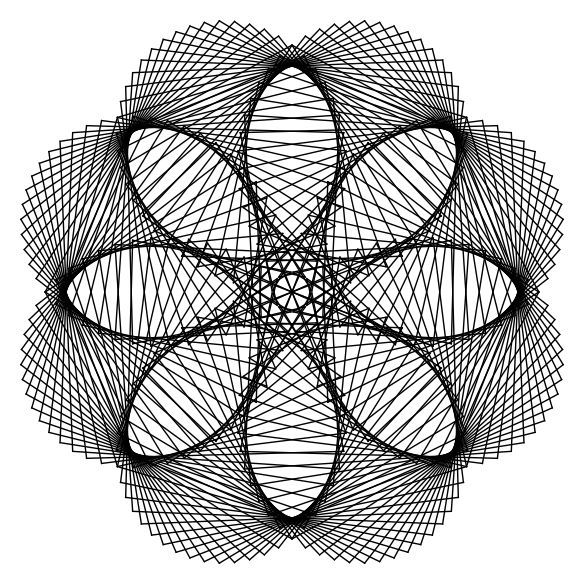
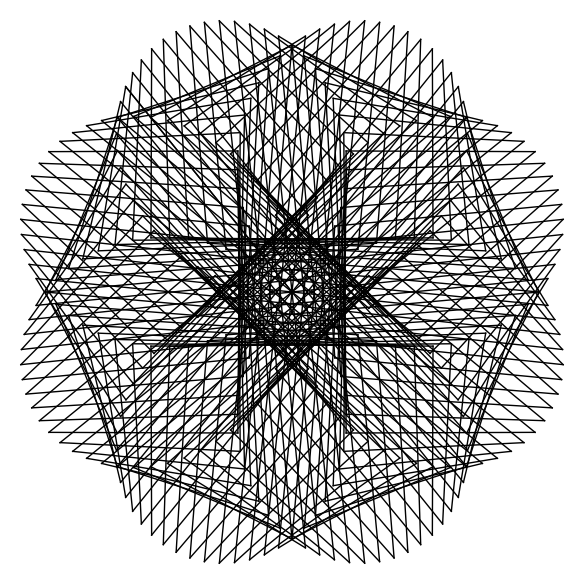
Some more, parametric plot using lines. Smooth edges are okay, few rough edges are a pain, many rough edges are soothing!
|
def draw(a,b,d):
    d=d*pi/180
    plt=Graphics()
    nn = 360
    for i in range(nn+1):
        plt += line2d([(sin(a*i*d)*sin(b*i*d),cos(a*(i)*d)*sin(b*(i)*d)),(sin(a*(i+1)*d)*sin(b*(i+1)*d),cos(a*(i+1)*d)*sin(b*(i+1)*d))],color='black')
    plt.show(frame=0,axes=0,aspect_ratio=1)
draw(3,4,11)
|
Change d to any other prime, also try changing a and b, there are many possibilities!