Interesting images using recurrences/iterations

Think of a simple figure. Now, think how it may look like if you repeat the same figure by placing it close to the original figure but smaller in size (e.g. by halving in size), and keep repeating.

Here are some snippets of code in Sage to use the idea using circles, experiment with it by changing the parameters/shape.

var('y')
plt=Graphics()
a=22
b=22
def doit(a,b,ra,cnt):
    global plt
    plt += circle((a,b),ra,color=(randint(0,cnt)/(1+cnt),randint(0,cnt)/(1+cnt),randint(0,cnt)/(1+cnt)))
    if cnt >5:
        return
    doit(a+ra/2,a,ra/2,cnt+1)
    doit(a-ra/2,a,ra/2,cnt+1)
    doit(a,a-ra/2,ra/2,cnt+1)
    doit(a,a+ra/2,ra/2,cnt+1)
doit(0,0,22,0)
plt.show(frame=False,axes=0)
../../images/circles1.png

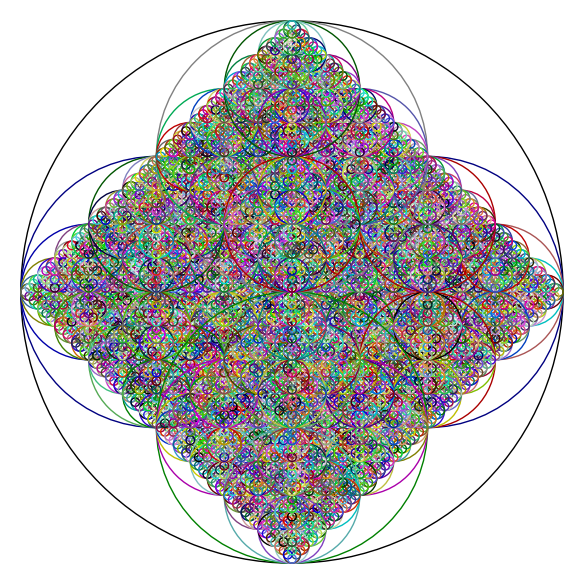
A saturn-like fractal

plt=Graphics()
a=22
b=22
def doit(a,b,ra,cnt):
    global plt
    plt += circle((a,b),ra,color=(randint(0,cnt)/(1+cnt),randint(0,cnt)/(1+cnt),randint(0,cnt)/(1+cnt)))
    if cnt > 5:
        return
    doit(a+ra/2,b,ra/2,cnt+1)
    doit(a-ra/2,b,ra/2,cnt+1)
    doit(a,b-ra/2,ra/2,cnt+1)
    doit(a,b+ra/2,ra/2,cnt+1)
doit(0,0,22,0)
plt.show(frame=False,axes=0)
../../images/circles2.png

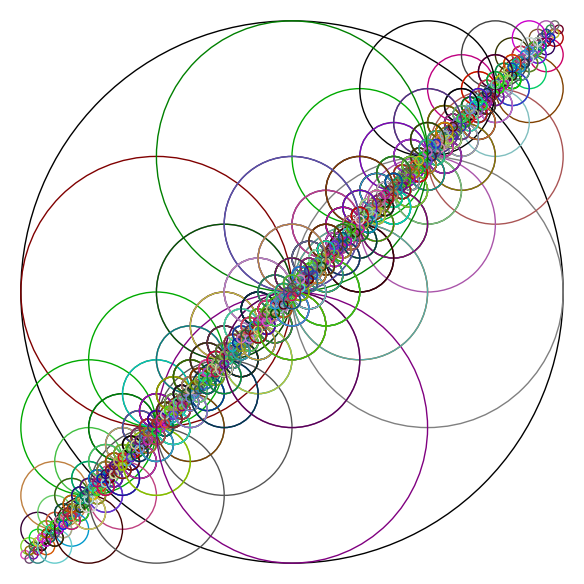
Another fractal using circles
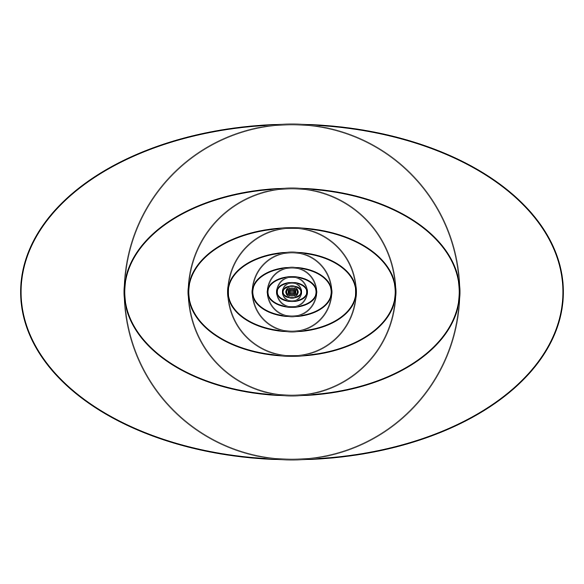
plt=Graphics()
a=16*golden_ratio
b=16
k=a/b
for i in range(11):
    plt += implicit_plot(x^2/a^2+y^2/b^2-1, (-a, a), (-a, a),color=(0,0,0))
    plt += implicit_plot(x^2/b^2+y^2/b^2-1, (-a, a), (-a, a),color=(.2,.2,.2))
    a = a/k
    b = b/k
plt.show(frame=False,axes=0)
../../images/eyes1.png

A fractal eye

The below two are from Knuth's TAOCP vol 2 -- a little bit of randomness is good!

1
2
3
4
5
plt=Graphics()
for a in range(-20,20,2):
    for b in range(-20,20,2):
        plt += line([(a,b),(a+1,b),(a+1,b+1),(a,b+1),(a,b)])
plt.show(frame=0,axes=0)
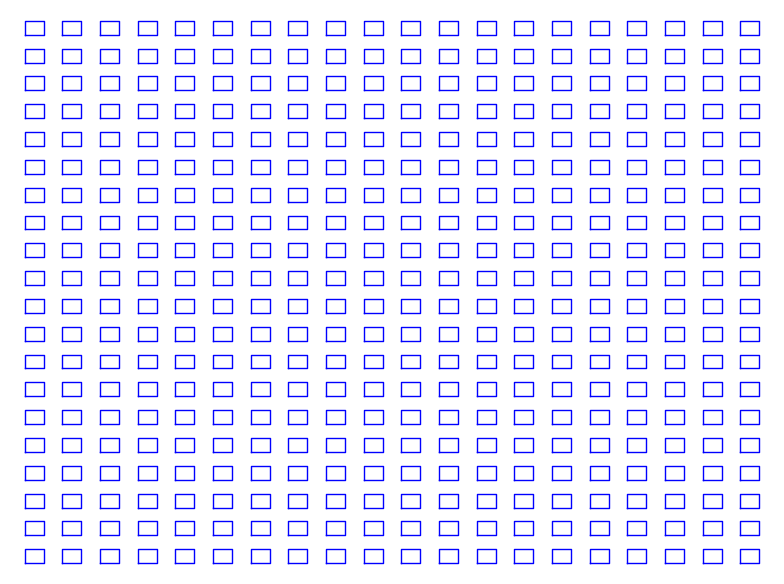
../../images/tiles1.png

Regular tiles

1
2
3
4
5
6
7
8
plt=Graphics()
def ran(): return random()*0.2-0.1
for a in range(-20,40,2):
    for b in range(-20,40,2):
        x1=a+ran()
        y1=b+ran()
        plt += line([(x1,y1),(a+1+ran(),b+ran()),(a+1+ran(),b+1+ran()),(a+ran(),b+1+ran()),(x1,y1)],color=(ran()+0.3,ran()+0.1,ran()+0.3))
plt.show(frame=0,axes=0)
../../images/tiles2.png

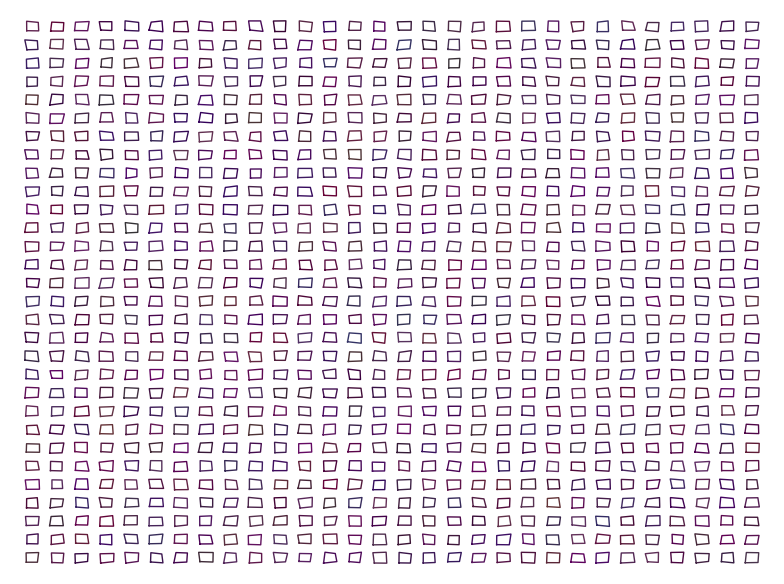
Slightly randomized tiles